Server monitoring as a widget.
Server status from Proxmox, Prometheus alerts, certificates and deployments on the home screen and lock screen of iPhone and iPad, from the homelab to the data centre. Your servers send, nobody connects in. No open port, no VPN.
Free for 7 days, then €4.99 a month.
You have monitoring. Just not in your pocket.
Reachable means exposed
For your iPhone to ask Grafana or Proxmox, it has to get in: port forwarding, a VPN or a tunnel. Each one is another door.
One app per tool
Proxmox has an app, Uptime Kuma too, Grafana a web UI. None of them has the whole picture.
Who tells you when it's all down?
If the server doing the monitoring goes down, nobody reports anything. Silence looks like all is well.
A service in a data centre, to try.
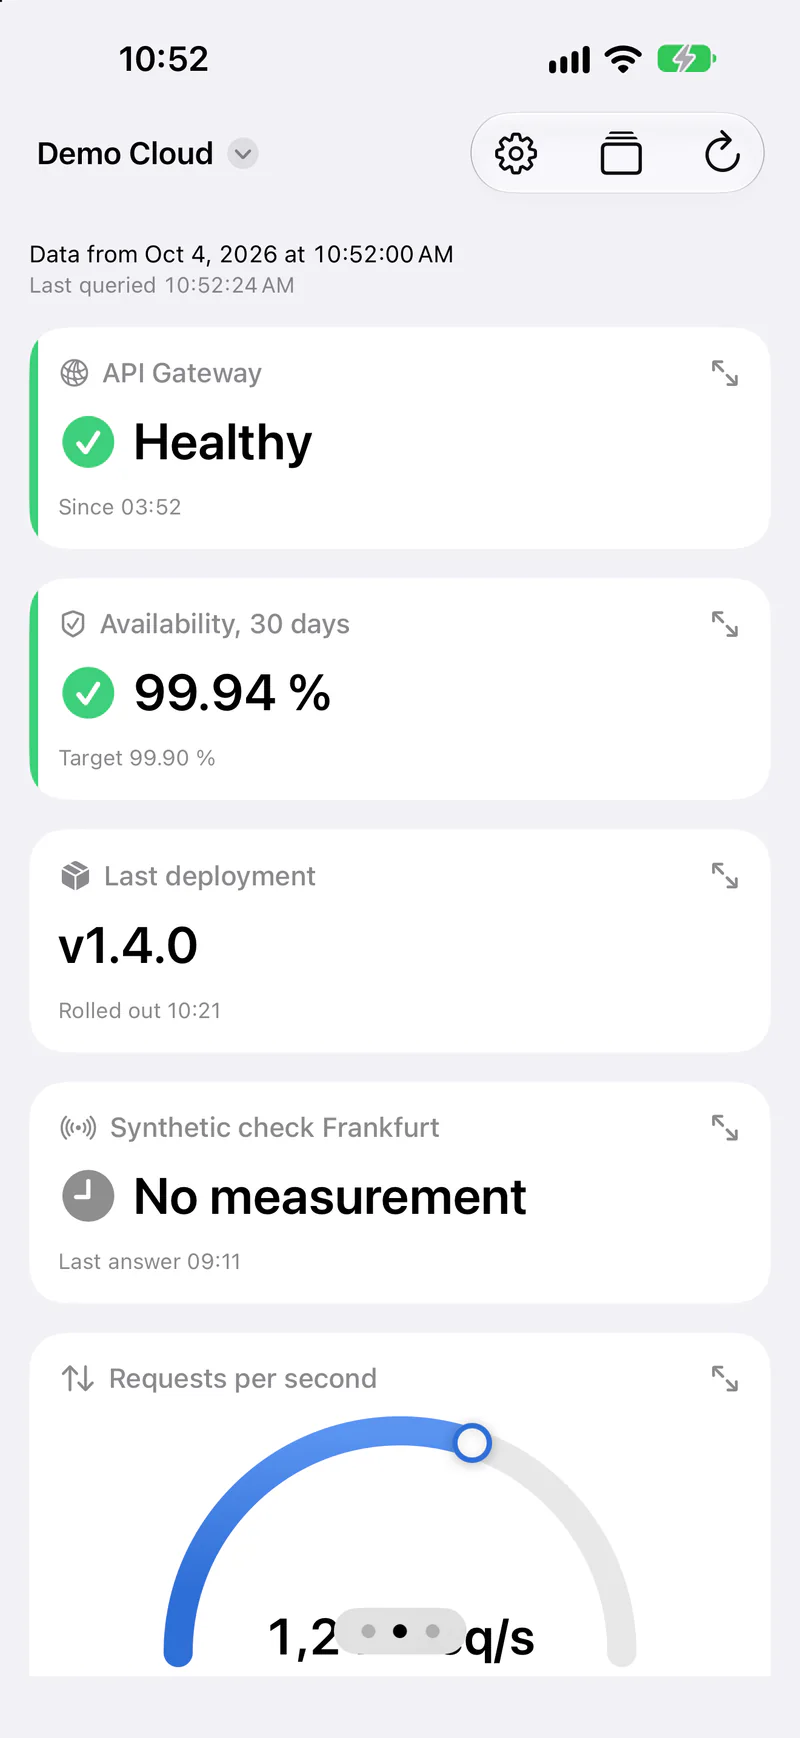
The demo simulates a web service on several nodes. Scan the code with the Andon app and it's on your iPhone.
- ✓State: API gateway, 30-day availability, last deployment.
- ✓Load: requests per second, p95 response time, error rate, cluster CPU.
- ✓Inventory: nodes with CPU and RAM, open incidents, storage used, certificate expiry.
- ✓No measurement: a check that doesn't answer turns grey, not green.
Cloud service
A service in a data centre: requests, response time, error rate, nodes, open incidents. A glance at the widget instead of logging in to a dashboard.
Your servers send. Nobody connects in.
A script or Node-RED on your server builds the view, encrypts it and sends it over HTTPS to the relay. A timer such as cron repeats it.
Get the numbers
A script asks what you already run, self-hosted or in the cloud: the Proxmox API, Prometheus, a health check, your CI's pipeline.
Set the status and seal
The script decides what is green, amber or red, and writes the view. A second one seals and uploads it. The templates come in Node.js and Python.
Grey when it goes quiet
If the server stays silent longer than agreed, the app turns the view grey. So you notice the outage that can no longer report itself.
Proxmox to iPhone, with one script.
Every Proxmox node already has pvesh and Python. The script asks the cluster for its nodes and guests and writes a view with three tiles.
- ✓A node offline turns its tile red. A stopped guest stays uncoloured: it may be off on purpose.
- ✓Sealing and uploading is
andon_seal.pyfrom the developer page. It needscryptographyandrequests; on Debian, and so on Proxmox, the packages arepython3-cryptographyandpython3-requests. - ✓A cron entry pipes the output to
andon_seal.pyevery minute, with the values from the.envas environment variables. - ✓For Prometheus alerts there's a second script on the developer page: alerts as a table.
Rather use Node-RED than scripts? That works too: Andon for Node-RED.
#!/usr/bin/env python3
# Proxmox as an Andon view: nodes and guests, from the cluster's own API.
# Runs on a Proxmox node, where pvesh is. Writes the document to stdout;
# andon_seal.py seals and sends it. The status is decided HERE.
import json, subprocess, sys
from datetime import datetime, timezone

res = json.loads(subprocess.run(
    ["pvesh", "get", "/cluster/resources", "--output-format", "json"],
    check=True, capture_output=True, text=True).stdout)

nodes  = [r for r in res if r["type"] == "node"]
guests = [r for r in res if r["type"] in ("qemu", "lxc") and not r.get("template")]
online  = sum(n["status"] == "online" for n in nodes)
running = sum(g["status"] == "running" for g in guests)

def row(g):
    ram = round(100 * g["mem"] / g["maxmem"]) if g.get("maxmem") else None
    cells = [g.get("name") or str(g["vmid"]), g["node"], round(100 * g.get("cpu", 0)), ram]
    # A stopped guest gets no colour: it may be stopped on purpose.
    return {"cells": cells, "status": "ok"} if g["status"] == "running" else {"cells": cells}

guests.sort(key=lambda g: (g["status"] != "running", g.get("name") or ""))

json.dump({
    "id": "5d0e8b47-2a19-4c63-9f8e-7b1a3c6d2e90",
    "schemaVersion": 1,
    "name": "Proxmox",
    "generatedAt": datetime.now(timezone.utc).strftime("%Y-%m-%dT%H:%M:%SZ"),
    "staleAfterSec": 300,
    "tiles": [
        {"id": "t_nodes", "view": "label", "title": "Nodes online", "titleShort": "Nodes",
         "icon": "server.rack", "value": online, "subtext": f"of {len(nodes)}",
         "status": "ok" if online == len(nodes) else "critical"},
        {"id": "t_guests", "view": "label", "title": "Guests running", "titleShort": "Guests",
         "icon": "shippingbox", "value": running, "subtext": f"of {len(guests)}"},
        {"id": "t_list", "view": "table", "title": "Guests", "icon": "list.bullet",
         "columns": [{"title": "Name"}, {"title": "Node"},
                     {"title": "CPU", "unit": "%", "decimals": 0},
                     {"title": "RAM", "unit": "%", "decimals": 0}],
         "rows": [row(g) for g in guests[:20]]},
    ],
}, sys.stdout)
Adds to Grafana instead of replacing it.
No way in
Outbound HTTPS only. No port, no VPN, no tunnel left open.
Everything in one place
Proxmox, alerts, certificates and CI side by side. Several sources get views of their own, and the app shows them all.
Silence becomes visible
A view without fresh data turns grey. That doesn't replace monitoring from outside, but you see that something is off.
End-to-end encrypted
Host names and numbers pass through the relay encrypted. Only your paired devices can read them.
Questions about server monitoring.
Do I need to open a port or run a VPN?
No. Your server only sends out, over HTTPS to the relay. Inbound, everything stays closed.
Does it work with Proxmox, Prometheus and Uptime Kuma?
With anything a script can query. The Proxmox script is above, the one for Prometheus alerts on the developer page. Uptime Kuma serves its figures at /metrics in Prometheus format.
How up to date is the status widget?
When a status changes, your source wakes the widget, usually within a minute. Otherwise iOS decides when to reload it, typically about every 15 minutes. The open app fetches new values every minute.
What happens when my server goes down?
Then no data arrives, and after the agreed time (staleAfterSec) the app turns the view grey. A server that is down can't send a wake-up: you see the grey the next time you look, not as a push.
Can I show the status of GitHub Actions or GitLab CI?
Yes, with a script that asks your CI's API and writes the result as a tile. There's no ready-made template for it yet.
Can the relay read my data?
No. The view is encrypted on your server; the key stays there and on your devices. The details are under How it works.
Andon elsewhere
Start with one server.
Build tiles in the configurator, create a view, pair your iPhone. Then put the script into cron.